|
|
||||||||
|
||||||||
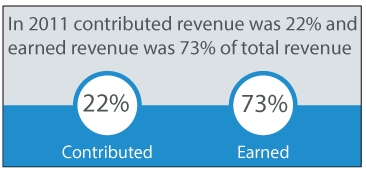 As the demand for nonprofit services increase and thus the operating expenses of nonprofit organizations keep rising, the need for nonprofits to have more predictable sources of income gains higher importance. Nonprofit organizations are finding opportunities to use their earned revenue, which comes from fees for services or other entrepreneurial sources, as an additional source of income. As can be seen on the chart to the right, an average of 73 percent of nonprofits' revenue was earned revenue in 2011, versus 22 percent which was revenue coming from contributions. Note: Government grants and contracts are represented variously in the earned and contributed revenue categories. At this time it is not possible to separately identify government sources. For example, government grants are often reported as grant income, confused with philanthropic grants. Reported contracted revenue, likewise, is not separated out and sometimes is reported as grant income. |
Note: These figures do not include all contributions to religious congregations, as they are not required to file with the IRS. Therefore, revenues and contributed revenues are underreported. |
|||||||
By Type of Nonprofit There is considerable difference in the use of earned revenue for hospitals versus the majority of the nonprofits. Hospitals are established so that their operations are mostly self-funded. The first chart below shows how hospitals' earned revenue - fees for services - represent 94 percent of their total revenue. Other organizations following similar pattern are hospices, credit unions, insurance providers, goodwill industries, and some education institutes such as universities, professional schools and special education. For the rest of the nonprofits however the pattern is different. As seen on the second chart below, most nonprofits continue to rely heavily on contributions from individuals, foundations and government. In 2011, contributed revenue was slightly lower, 43 percent, than earned revenue, 49 percent, for these nonprofits. |
||||||||
|
||||||||
|