
 |
 |
 |
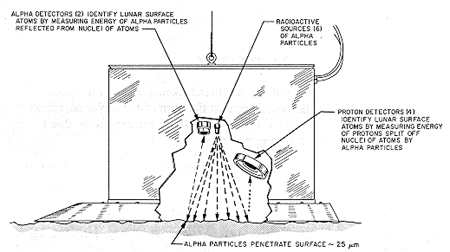
We can identify the composition of the planet Moon or Mars by placing
a radioactive source on the planet and measuring the energetic particles
and X-rays emitted from the soil. The figure below is a schematic of the
sensors used to analyze the lunar soil in 1967.
On the earth, we generate the energetic particles in analytical instruments such as the scanning electron microscope (called an electron microprobe) and measure the energies of the X-rays emitted from the sample.
The general concept is shown in Figure 1: electrons are knocked out of occupied levels by energetic X-rays, electrons, or ions (either protons - H+ - or alpha particles - He++), electrons make transitions from filled to empty states and emit an X-ray. The energy of the emitted characteristic X-ray identifies the atom.
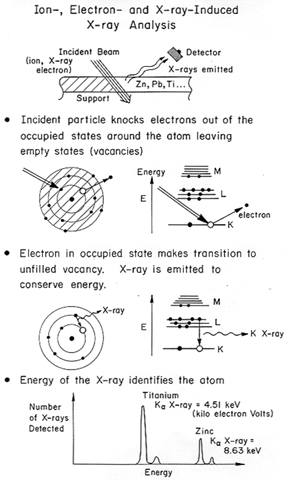
Figure 1: Atom identification by ion-, electron-, and X-ray- induced X-ray emission.
X-ray Fluorescence (XRF)
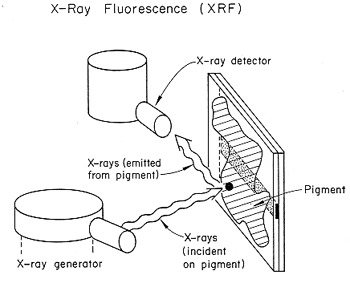
This is equipment used in art museums, for example, to examine the materials composition of pigments in paintings. Identification of pigments can place the painting in an appropriate time frame. Figure 2 shows schematically the setup.
The incident X-rays must have an energy equal to or greater than the binding energy, EB, of the electrons in the occupied levels
 EB
EBThe electron energy levels are grouped in bands with each band differing from each other by about a factor of ten. The inner-most with the highest binding energy is called the K-shell, the next level is the L-shell, then M-, and so forth.
(taken from Feldman and Mayer, Fundamentals of Surfaces and Thin Film Analysis)
| Atomic | Bin | ding | Energ | ies (eV) | |
| Element | Number,Z | K | L3 | M5 | Kalpha |
| Aluminum, Al | 13 | 1560 | 73 | - | 1490 |
| Silicon, Si | 14 | 1839 | 99 | - | 1740 |
| Iron, Fe | 26 | 7114 | 710 | 6 | 6400 |
| Cobolt, Co | 27 | 7709 | 779 | 3 | 6930 |
| Silver, Ag | 47 | 25,514 | 3351 | 367 | 22,110 |
| Cadmium, Cd | 48 | 26,711 | 3538 | 404 | 23,110 |
| Gold, Au | 79 | 80,725 | 11,919 | 2206 | 68,200 |
| Mercury, Hg | 80 | 83,103 | 12,284 | 2295 | 70,180 |
Table 1 lists the binding energies, EB, of the electron levels where EB is the energy required to remove an electron from an energy level and place it outside the atom. If you consider the energies for Fe, you find a factor of 10 difference between levels, for example EB(Kalpha) = 10 x EB (L3). There are many sublevels in electron energy levels (L1 to L3, M1 to M5, and so forth). Table 1 lists the outer ones because they are the levels predominantly involved with electron transitions.
The X-ray energies are given by the binding energy difference between the levels. For the 2 dominant lines
EX-ray(Lalpha) = EB(L3) - EB(M5)
Electron Microprobe (e- probe)
The differences between the electron microprobe and X-ray fluorescence (XRF) are seen in Figure 3. In XRF the incident X-rays travel in air with a beam several millimeters in diameter. Absorption in air by X-rays is minimal and the arriving X-rays have their full energy. Electrons, on the other hand, lose energy and are scattered by air and so electron microprobe measurements are carried out in vacuum. This means the samples must be small enough to fit in the analysis chamber and also non-degradable in vacuum. Surprisingly, many insects and organic samples can withstand vacuum conditionis although they require coating of a conductive film such as carbon or gold to prevent voltage build-up by the charges in the electron beam. The electron beam, however, can be focused to provide a micron-sized beam which can be positioned on the sample.
Figure 3
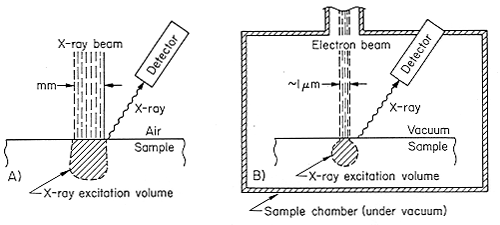
In both XRF and electron beam the X-rays emitted by the sample have characteristic energies which identify the atom. The relative intensity (or yield) of thie detected characteristic X-rays from different atomic elements is used to determine the chemical composition (the ratio of elements) of the sample.
Particle-induced X-ray Emission (PIXE)
Several million electron-volt (MeV) protons (singley-charged hydrogen ions) or alpha particles (doubly-charged helium ions which contain two protons and two neutrons) produced by ion accelerators are used to generate X-rays for materials analysis by particle-induced X-ray emission (PIXE). There are hundreds of these accelerators in the U.S. and world-wide located in universities and commercial laboratories. These accelerators produce a highly controlled beam of charged particles so that a known number of particles of known energy can be delivered to the sample. The analyses can be carried out in vacuum or in air. For in-air analysis the ion beam, usually protons, passes through a thin membrane into air and onto the sample. Million electron-volt protons can pass through the thin membrane and several centimeters of air without substantial energy loss.The technique of measurement in air where the energetic ions are taken from the vacuum in the ion accelerator beam into air is referred to as external beam line measurements. Figure 4 shows the experimental set-up which is used for large or vacuum-incompatible objects.
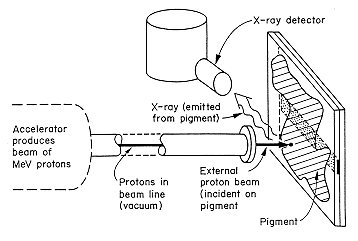
Figure 4. Schematic of the set-up for an external proton beam used in particle-induced X-ray emission (PIXE).
Sample Analysis: Elements and Composition
Electrons, ions, and X-rays are used to knock electrons out of occupied energy levels and to produce emission of characteristic X-rays. The energies of these identify the elements. The K. L, and M X-rays are a fingerprint of the element. Figure 5 is an X-ray energy versus yield (number of detected X-rays) for an external proton beam PIXE analysis of a rock sample from Bisbee, Arizona. The X-ray identification is given of all the major peaks for elements from sulfur to iron. The a notation Ka and La refers to "alpha", the primary transitions, and b refers to "beta", a less intense line than "alpha". The Ar peaks occurs because the protons travel in air and cause X-ray emission from argon, the major impurity in air.
Figure 5
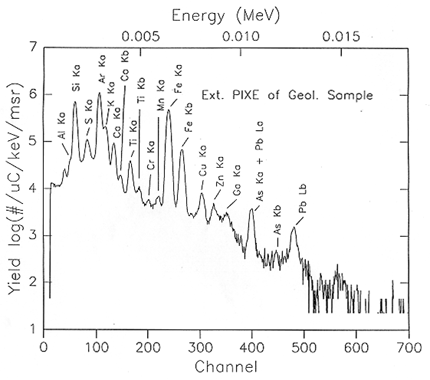
The number of detected X-rays or X-ray yield, YX-ray, in each peak is determined by the concentration N in atoms per centimeter cubed (cm3) and by the probability P that an incident energetic particle will create a vacancy in an inner-shell electron energy level by knocking out an electron.
The subsequent processes of electron transitions to fill the vacancy and of X-ray emission are all the same for each of the incident particles whether ion, electron, or X-ray. However, the probability P of creating a vacancy varies by orders of magnitude between the energetic particles and the different elements. A more detailed discussion can be found in Fundamentals of Surface and Thin Film Analysis by L. Feldman and J. Mayer (North-Holland, New York, 1986).
The three techniques - XRF, e- probe, and PIXE - have been used successfully to analyze a wide variety of samples from modern semiconductors to ancient ceramics and from moon rocks to paint pigments. Air pollutants such as lead or bromine can be analyzed by sucking air through a filter and then analyzing the filter by PIXE, for example.
Remote Sensing
The analysis of the moon by the surveyor alpha particles was the first figure and the last figure will be the Alpha Proton X-ray Spectrometer on the Sojourner Rover on the Mars Pathfinder Mission.
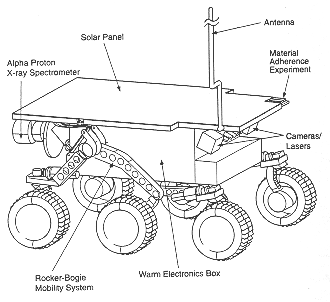
Figure 6. The Sojourner Rover measures about 65 centimeters x 48 centimeters and weighs about 10.6 kilograms on the surface of Mars. It is fitted with several different kinds of sensors for collecting data about the Martian environment (NASA).
The concept is the same on both missions separated by 30 years: a radioactive source emits energetic alpha particles which strike the lunar or martian soil. These collisions with the soil cause emission of X-rays, protons, and other particles. The accumulation of data from detected particles allows the Sojourner's sensor to measure the geologic composition of rocks and surface soil.
Page authored by the ACEPT W3 Group
Department of Physics and Astronomy, Arizona State University, Tempe, AZ 85287-1504
Copyright © 1995-2000 Arizona Board of Regents. All rights reserved.