Oceanic Mapping
Ryan Sullivan, Hrafnihildur Jonasdottir, Jessica Santiago, Emily Nelson -- Spring 2009
Historical Mapping of Krakatoa
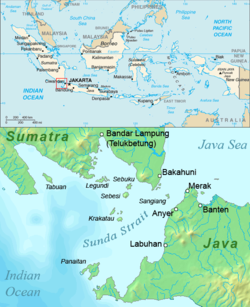
Location
Located between Indonesia�s two largest islands, Java and Sumatra. Krakatoa is directly above the subduction zone of the Eurasian Plate and the Indo-Australian Plate where the plate boundaries make a sharp change of direction, possibly resulting in an unusually weak crust in the region.
Early History
416 AD - The Javanese Book of Kings (Pustaka Raja) records that in the year 338 Saka (416 AD) there was a large eruption in this area. Although there is no geological evidence of a Krakatoa eruption of this size around that time.
535 AD - Many claim that a violent volcanic eruption, possibly of Krakatoa, in 535 may have been responsible for the global climate changes of 535-536. David Keys explores what he believes to be the radical and far-ranging global effects of just such a putative 6th-century eruption in his book Catastrophe: An Investigation into the Origins of the Modern World. Additionally, in recent times, it has been argued that it was this eruption which created the islands of Verlaten, Lang, and the beginnings of Rakata�all indicators of early Krakatoa's caldera's size. However, to date, little, if any, datable charcoal from that eruption has been found.
1883 - Its best-known eruption culminated in a series of massive explosions on August 26�27, 1883, which was among the most violent volcanic events in modern times.
With a Volcanic Explosivity Index (VEI) of 6, the eruption was equivalent to 200 megatons of TNT�about 13,000 times the yield of the Little Boy bomb (13 to 16 KT) that devastated Hiroshima, Japan during World War II and four times the yield of the Tsar Bomba (50 MT), the largest nuclear device ever detonated.
Eruptions at the volcano since 1927 have built a new island in the same location, named Anak Krakatau (Indonesian: "Child of Krakatoa"). This island currently has a radius of roughly 2 kilometres (1.2 mi) and a high point around 300 metres (980 ft) above sea level, growing 5 metres (16 ft) each year.
Geographic Effects
As a result of the huge amount of material deposited by the volcano, the surrounding ocean floor was drastically altered. It is estimated that as much as 18-21 km� of ignimbrite was deposited over an area of 1.1 million km�, largely filling the 30-40 m deep basin around Krakatoa. The land masses of Verlaten and Lang were increased, and volcanic ash continues to be a significant part of the geological composition of these islands. Poolsche Hoed ("Polish Hat") disappeared. A new rock islet called Bootsmansrots ('Bosun's Rock', a fragment of Danan) was left.
The fate of Krakatoa itself has been the subject of some dispute among geologists. It was originally proposed that the island had been blown apart by the force of the eruption. However, most of the material deposited by the volcano is clearly magmatic in origin and the caldera formed by the eruption is not extensively filled with deposits from the 1883 eruption. This indicates that the island subsided into an empty magma chamber at the end of the eruption sequence, rather than having been destroyed during the eruptions.
In 2004, researchers proposed the idea that the blood-red sky shown in Edvard Munch's famous 1893 painting The Scream is also an accurate depiction of the sky over Norway after the eruption. Munch said: "suddenly the sky turned blood red ... I stood there shaking with fear and felt an endless scream passing through nature."
Historical Mapping
The use of historical writings such as diaries, maps and other books can give helpful information on the creation of islands such as Krakatoa. Although this type of information is not always accurate, it will enhance further investigations such as searching for geological evidence that can give us a clue of a more exact date of an eruption.
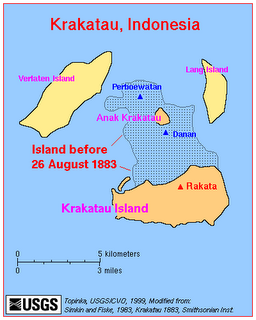
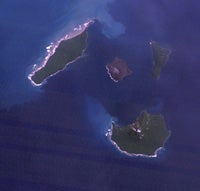
The map shows Krakatoa and the surrounding islands after the main blast with their previous outlines.
Relative Dating
Stratigraphic dating is accomplished by interpreting the significance of geological or archaeological strata, or layers. The method begins with the careful drawing and description of strata (the geological or archaeological profile). The profile from one location is then compared with profiles from surrounding sites. Stratigraphic dating assumes that the lower layers in any particular profile are older than the upper layers in that profile ("the law of superposition") and that an object cannot be older than the materials of which it is composed. Igneous masses are dated according to whether they caused metamorphism in the surrounding rock (proof of emplacement in preexisting rock) or whether sediments were deposited on them after they were formed. In geology, a master stratigraphic sequence for a particular region is built up by correlating the strata from different locations with one another. As new locations are investigated, the geologist attempts to fit the new profiles into the master sequence of geo logical strata for that region. The depth of the strata within the master sequence provides the investigator with the relative date of any particular profile.
Absolute Dating
Absolute dating can be achieved through the use of historical records and through the analysis of biological and geological patterns resulting from annual climatic variations, such as tree rings (dendrochronology) and varve analysis. After 1950, the physical sciences contributed a number of absolute dating techniques that had a revolutionary effect on archaeology and geology. These techniques are based upon the measurement of radioactive processes (radiocarbon; potassium-argon, uranium-lead, thorium-lead, etc.; fission track; thermoluminescence; optically stimulated luminescence; and electron-spin resonance), chemical processes (amino-acid racemization and obsidian hydration), and the magnetic properties of igneous material, baked clay, and sedimentary deposits (paleomagnetism).
More Info about Relative and Absolute Dating
Current Tracking or Mapping of Oceanic/Volcanic Islands
�Most oceanic islands originated from ancient volcanic activity. Volcanic islands form along the boundaries of tectonic plates. Evidence of this process can be seen in the �island arcs� of Japan and the Philippines.
Volcanic islands are also created by �hot spots�. From deep within the earth�s mantle, magma rises up and spews lava onto the sea floor. Over time, the lava builds up and emerges above sea level to form an island volcano. Eventually tectonic plates move the volcano away from the hot spot, essentially cutting off its supply of magma and thus forming an island. Chains of islands are formed as, over time volcano�s are formed and then carried away by the tectonic plates. Examples of this process include the islands of Hawaii, the Canary Islands and the island nation of Tuvalu.�
REF: http://www.privateislandsblog.com/2007/06/26/island-formation-where-do-islands-come-from/
Forecasting or Predicting Volcanic Eruptions
Warning Signs
Before an eruption, magma moves into the area beneath the volcano and collects in a magma chamber, or reservoir. As it comes closer to the surface, the magma releases gases. These events can offer valuable clues about the likelihood of an eruption. For example, the movement of magma produces small earthquakes and vibrations (seismicity). Magma gathering in a chamber causes slight swelling of the volcano's slopes. Gases released near the volcano can be measured for changes in quantity and makeup.
Monitoring Methods
A number of tools can be used to record these warning signs. Seismographs can detect small earthquakes, while tiltmeters and geodimeters can measure the subtle swelling of a volcano. Correlation spectrometers (COSPECS) can measure amounts of sulfur dioxide--a telltale gas that is released in increasing quantities before an eruption. Using these and other tools, it's possible to closely monitor activity at an awakening volcano.
REF: http://www.learner.org/interactives/volcanoes/forecast.html
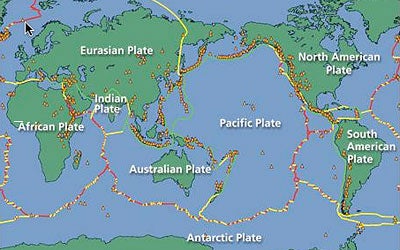
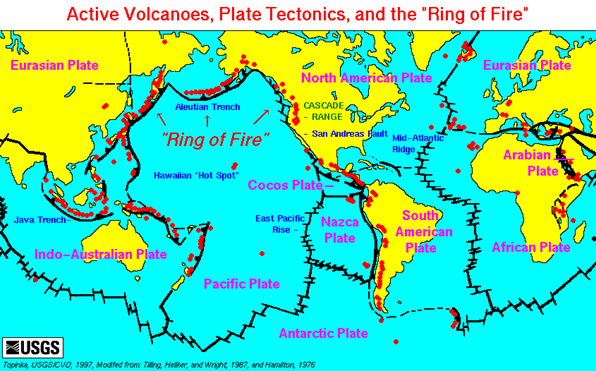
This map highlights active volcanoes on land and in shallow water. Notice how many are concentrated along plate boundaries especially where two plates are moving apart (red lines) or coming together (green lines).
REF: World Volcano Watch
Google Maps
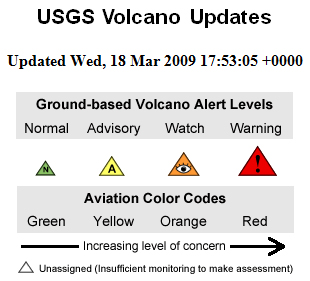
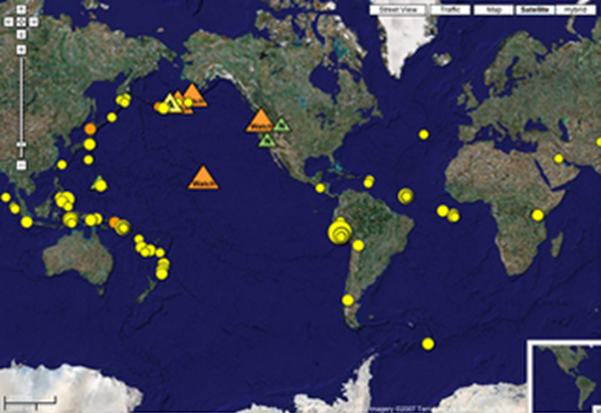
The Volcano Mapplet displays the latest U.S. volcano updates, showing the current level of both ground-based and aviation hazards. Clicking on an alert icon provides a summary of the volcano update along with a link to the USGS Volcano Hazards Program website for additional details and images.
REF: http://google-latlong.blogspot.com/2007/08/posted-by-scott-haefner-and-dina.html
REF: http://vulcan.wr.usgs.gov/Glossary/PlateTectonics/Maps/map_plate_tectonics_world.html
[Tectonic motion for points around the world can be estimated from a variety of space geodetic technologies (e.g., satellite laser ranging (SLR), Very Long Baseline Interferometry (VLBI), Global Positioning System (GPS) among others).]
REF: http://cddis.nasa.gov/926/slrtecto.html
Short visualization of an island chain forming over a hot spot
REF: http://www.hawaii.edu/environment/ainakumuwai/html/ainakumuwaiislandformation.htm
Visualization Link
Examine an animation of plate movement predicted for the future
Some "Newly" Formed Islands
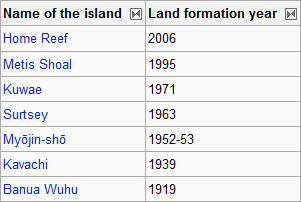
REF: http://en.wikipedia.org/wiki/New_islands
Anak Krakatau
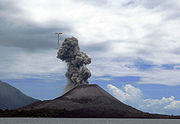
Verbeek, in his report on the eruption, predicted that any new activity would manifest itself in the region which had been between Perboewatan and Danan. This prediction came true on 29 December 1927, when evidence of a submarine eruption was seen in this area (an earlier event in the same area had been reported in June 1927). A few days later, a new island volcano, named "Anak Krakatau" ("Child of Krakatoa"), broke water. Initially, the eruptions were of pumice and ash, and it (and two later islands) was quickly eroded away by the sea; but eventually Anak Krakatau #4 (broke water in August 1930) produced lava flows faster than the waves could erode them. Of considerable interest to volcanologists, this has been the subject of extensive study.
REF: http://en.wikipedia.org/wiki/Anak_Krakatau#Anak_Krakatau
Prediction of a New Island to the Hawaiian Island Chain
The Hawaiian Island Chain is a series of eight islands located in the middle of the Pacific ocean, approximately 2,400 miles west of the California coast and 3,850 miles east of Japan. The chain runs in a northwest-southeast orientation ("\"), with the oldest islands in the northwest, getting progressively younger to the southeast.
Going in order from the northwest, the islands are:
- Ni'ihau
- Kaua'i
- O'ahu
- Moloka'i
- Lana'i
- Maui
- Kaho'olawe
- Hawai'i (The Big Island)
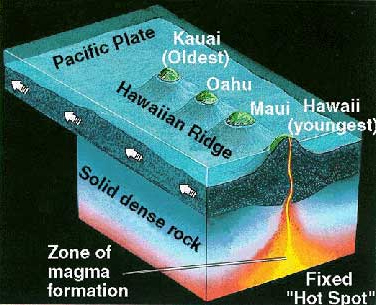
The chain began forming approximately 70 million years ago as the Pacific tectonic plate began moving over a hot spot. A hot spot is a plume of magma or molten rock that rises from within the Earth and pushes through the tectonic plates, forming volcanoes. In this case, the Hawaiian hot spot remained stationary and the Pacific plate moved over it towards the northwest. Each time the plate moved to a new area, the hot spot produced another island.2 This is the reason Ni'ihau is the oldest island, and by the same token, Hawai'i is the newest. In fact, the island of Hawai'i is currently still over the hot spot (feeding its volcanoes with fresh magma), though it is slowly moving off of it. True to the hot spot theory, a new Hawaiian island is forming, 35km south of the Big Island. Already named Loihi, the island-to-be is slowly building on the seafloor southeast of Kilauea. Its top is 3000 feet below the water surface, and will break the surface in the next 10,000 to 100,000 years.
REF: http://everything2.com/title/Hawaiian%2520Island%2520Chain
Geothermal Spots
�Our present day ability to study hydrothermal systems is severely limited by our inability to detect and map flow fields in a systematic manner over large areas of the seafloor. Exploration still plays a fundamental role in the science of seafloor hydrothermal systems. Discoveries often happen by chance rather than by systematic surveying and remote sensing.�
-Chris Jones
History of Imaging
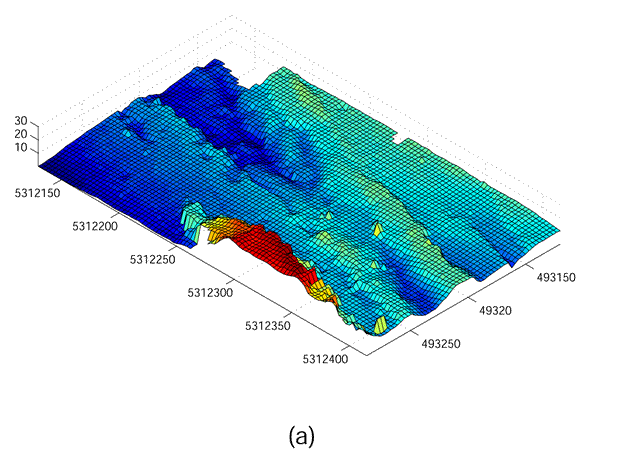
Electrical Resistivity Tomography (ERT)
Currently, as in the past few decades, the most common form of geothermal mapping is through static images. This is good for a slice of information, but it fails to give an impression of volume and size, especially in relation to time. Resistivity imaging is common, more so in land based application, but it is also used for exploration of underwater vents. Typically it is done by dropping an electrode through a borehole to gather data. It has been more effective than ground penetrating radar when analyzing bodies of water.
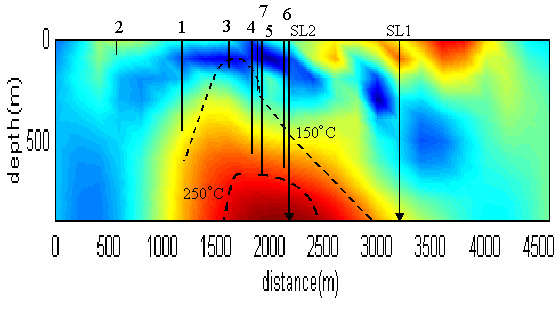
Resistivity imaging of a geothermal reservoir
Imaging from Sonar Geometry
While static images only tend to cover one aspect of these sea vents, 3d models and animations can cover temperature, pressure, density, vapor saturation, and fluctuation over time. Use of sonar is growing in popularity to gather data for single spots.
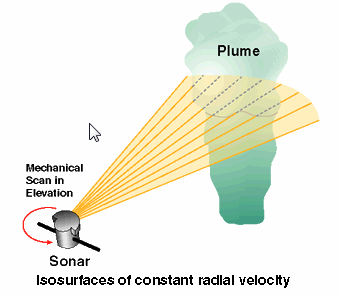
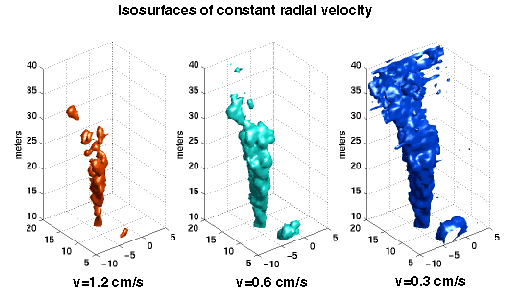
This gives a much better image of how the vent works, not just its temperature. The acoustic survey method is used for larger areas as well.
Google Earth
For a quick overview, Google Earth has a number of databases that are updated with any new activity. This is useful to spread findings outside of just the scientific community.
Why Bother Mapping Geothermal Spots?
It may look like a fairly dry area of science, but this kind of imaging deals with scientific applications as well as finding potential energy sources. With the amount of species living in close contact with each other at an ocean vent, and without the need for sunlight to sustain an ecosystem, they provide ample opportunities for studying biodiversity. Because the reactions occurring happen from part of the Earth�s mantle, they are very close to the reactions that formed the world billions of years ago.
As an alternative energy source, geothermal energy is clean and less invasive than tidal energy. And with better mapping and imaging, generators can be set up in spots without a lot of biodiversity and without the guesswork, reducing impact on the ecosystem.
There is also speculation that mapping these areas and the changes will make it easier to predict new quakes and tsunamis by finding weak points in the Earth�s mantle.
Sources
- http://www-eaps.mit.edu/erl/environmental_resistivity1.html
- http://www-eaps.mit.edu/erl/environmental_resistivity2.html
- http://www.oar.noaa.gov/oceans/t_oceanmapping.html
- http://www.whoi.edu/sbl/liteSite.do?articleId=28267&litesiteid=18873
- http://www.nicholas.duke.edu/OSCexpedition/background.html
- http://depts.washington.edu/aploa/ARSHF/index.html
- http://exergy.se/goran/cng/alten/proj/98/geotermal/geo.htm#_Toc492881514