Latinos and Education
A Regional Overview of the Southwest
Population
While the Latino population in the United States is spread across the nation, the greatest concentration of Latinos (in numbers and percentage of population) is in the Southwest. The 2000 Census Count reported an estimated national population of 281.4 million. The greatest population growth is concentrated in two counties in the Southwest: Henderson County, Nevada, which is number one, and Maricopa County, Arizona, which is number two. Almost a quarter of the nation's population, 65.9 million, resides in the five states this report addresses (Arizona, California, Colorado, New Mexico, and Texas). Additionally, the 2000 Census Count reported that there are 35.3 million Latinos in mainland United States, with another 3.9 million in Puerto Rico. A little less than 58 percent, or 20.4 million, of all Latinos in the United States are found in these five states. One must keep in mind that these numbers do not reflect a fully accurate count. The Census Bureau has estimated a 1.18 percent undercount for the total population, and a 2.85 percent undercount for Latinos. (See Table 1)
Table1
U.S. Population 2000
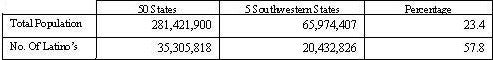
Source: Hispanic Outlook in Higher Education September 10, 2001. p. 20
In all five states, with the exception of Colorado, a quarter of their population is composed of Latinos. While New Mexico has the highest percentage of Latinos in its state population, 42.1 percent, California has the greatest number of Latinos, 33.8 million. Almost one third of the population in the Southwest is Latino. (See Table 2)
Table2
Southwest Regional Population 2000
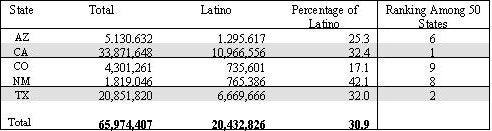
Source: Hispanic Outlook, September 10, 2001
Lastly, most of the growth in these five states is the result of the Latino population growth. A number of factors contribute to this Latino increase, such as immigration rates, higher birth rates than other groups, as well as larger family size. Moreover, the Latino population is younger in age than the White population. All five southwestern states rank within the top ten states for the highest Latino population. The region also has both the number one state with the highest Latino population (California) and the second highest state with Latinos (Texas). The direct consequence to education of this growth and concentration of Latinos is that there is a larger number, and continual increase in the number of, school-age children. In all five states there are school districts where the student enrollment is over 80 percent Latino.
Educational Indices
Enrollments and Graduation
As the general population has increased over the past decade, so has student enrollment. The K-12 grades have a greater increase in numbers than higher education. The total enrollment for K-12 in the United States is at an all time high of 42.5 million students, of which the Latino student national enrollment is 16.2 percent or 6.8 million. The largest percentage growth in public school enrollments was in the West, at about 9 percent, with Latino students constituting 39.8 percent of all students.
In a ten-year period from 1986 to l996, the Limited English Proficient (LEP) student national enrollment has increased from 1.5 million to 3.4 million. Of the 1996 LEP total enrollment numbers, the five southwest states constituted 57.2 percent. California and Texas were ranked first and second respectively with the most LEP students, while Arizona and New Mexico were ranked 6 and 7 respectively. (See Table 3)
Table3
Percent and Number of LEP Enrollment by State for 1996
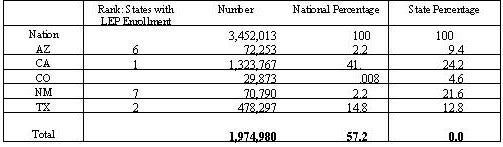
Source: IDRA Newsletter, August 2001.
Notes:
-
33 states report 5.1% (37,837) retained 1 or more grades
-
33 states report 1.7% (14,032) dropped out
-
30 states report 19.3% (253,763) scored below state norms Reading
-
30 states report 16% (211,433) scored below state norms Math
18 states report 6.9% (52,880) scored below state norms Science
- 17 states report 6.6% (51,388) scored below state norms Social Studies
40% of U.S. Teachers reported having LEP students in 1994 but only 29% of teachers received training at all in how to serve LEP students
All regions will experience growth in the number of high school graduates, with the Western Region leading at 13 percent more high school graduates. The Latino student increase is the greatest of all groups, while White student numbers are declining. The number of Latino public high school graduates has increased to 31.6 percent or approximately 65,200 more Latino high school graduates. Also, Latino graduate percentage for four of the five states range from just over one fourth of all graduates (AZ) to one third (CA & TX) to almost one half (NM). Only Colorado has fewer than one quarter of all graduates being Latino. (See Table 4)
Table4
Projected High School Graduates 2001-2002
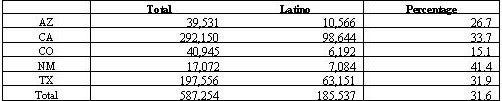
Source: WICHE Projections of High School Graduates by state and race/ethnicity 1996-2012. (Feb. 1998).
Notes:
-
By 2000-01 enrollments in public schools are expected to be at an all time high of 42.6 million students
-
The largest percentage growth in public school enrollments between 1995 and 2001 will be in the West (9 percent).
-
Nationally, after 1993-94 the number of high school graduates is projected to rise steadily, reaching a high
of 3.2 million in 2007-08.
-
All regions will experience growth in number of high school graduates with the West leading (13 % more
high school graduates).
The number of Latino public high school graduates is projected to increase 30% by 2001, or approximately 65,200 more Latino graduates.
In the higher education sector, enrollment growth somewhat matches the K-12 trends. National enrollments in 2001-02 for public four-year institutions are 5,969,950 and for public two-year institutions are 5,339,449. National total enrollment of Latinos in public and private two- and four-year institutions is 1,316,616 or 8.9 percent. California and Texas rank one and two respectively in total student enrollments. When examining only public four-year and two-year undergraduate enrollments, there are more people enrolled in two-year institutions than four year. Latinos enroll disproportionaly in greater numbers in two-year institutions than four-year institutions. While a little more than one third of all college students attend two-year institutions, more than half of all Latinos students are found in these institutions. Also, a new trend has emerged, in which significantly more Latinas (women) are enrolled in higher education than Latinos (males). These national trends are also found in the five states. Using Arizona as one example, 25 percent of the state population is Latino, yet only 10.9 percent is enrolled in public four-year undergraduate higher education, in comparison to 18.9 percent in two-year public institutions. Of the 10.9 percent in four-year public institutions, 58 percent are Hispanic females and 41.8 percent are Hispanic males. This Arizona profile is the same for each of the other four states. (See Table 5)
Table5
Fall 1999 Total enrollment (undergraduates and post-baccalaureate students headcounts)
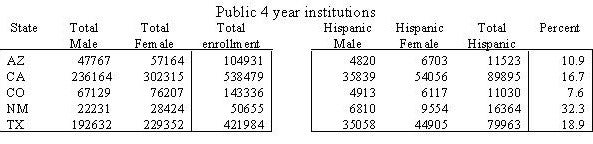
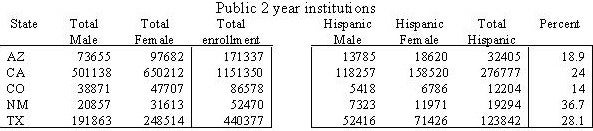
Source: National Center for Education Statistics. 2001 Data files titled IC99_HD and EF99_ANR downloaded on 9/20/2001 form http//www. nces.ed.gov/ipedspas. WICHE calculations.
State and School Funds
In Table 6 economic information is provided about state support of public Pre-K to 12 education along with the total number of Pre-K to 12 student enrollments. Specifically, the table contains (a) total state expenditures, (b) total state funding of higher education and (c) state funding per pupil Pre-K to 12. State funding per pupil reveals that of the five southwestern states: Arizona (47), California (40), and Colorado (39) rank in the bottom quartile or lowest per pupil funding, and New Mexico (35) and Texas (31) rank in the second to the bottom quartile. The most state funding per pupil is $10,650 by Alaska and the least state funding per pupil is $4,293 by North Dakota. (See Table 6)
Traditional Instructional Measures of Quality
Also, Table 6 shows information about three more traditional information indicators that are used to gauge quality of education provided, specifically (1) Pupil/Teacher ratio, (2) average teacher salary, and (3) drop-out rates for Latinos. Three of the five states have the highest pupil/teacher ratio: California ranked second with 21.6 pupils per teacher, Arizona ranked fourth, and Colorado ranked ninth in the nation. New Mexico is ranked 20 and Texas is ranked 34 with 15.3 pupils for each teacher. Nationally, the lowest per pupil ratio to teacher is 13.6 in New Jersey and the highest is 22.4 in Utah.
Table6
Statistic on Hispanic Education
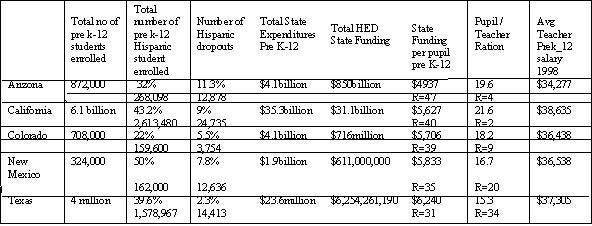
Probably one of the most important indicators used to measure educational quality or school effectiveness by Latinos and other persons of color is the drop-out rate, i.e., students leaving school permanently without a high school diploma. It must be noted that state reporting of dropout numbers and percentages has been and continues to be problematic. Typically, state departments use definitions that depress an accurate count, and school districts are poor about reporting student status, hence both procedures produce undercounts. While state numbers and percents are questionable, it is clear that historically, Latino drop-out numbers and rates are high and typically the highest among all student groups. For example, in Colorado, the Latino drop-out rate is reported as 5.5 percent and is the highest of all student groups. In Arizona, the Latino drop-out rate is reported as 11.3 percent, second highest after Native Americans. In total numbers, Latinos left school the most (12,878) or 42.7 percent of all student groups, including White students and in comparison to Native Americans (3,557). Similarly, in Texas, Latinos have a reported annual drop-out rate of 2.3 percent, which is equal to African Americans. However, when you examine the numbers, 2.3 percent equals 14,413 for Latinos and 5,582 for African Americans. In Texas, Latinos constitute 52.2 percent of all dropouts, where as African Americans constituted 20.5 percent. One recent study, conducted by IDRA in Texas, pointed out that a number of students were left out of the annual counts because of a limited definition used by the Texas Education Department, and thus IDRA estimated that between the years of 1985 and 2000, 1.6 million secondary school students left school early. The majority of Texas student loses were Latino and African American.
Summary
The national, regional, and state patterns are the same: increased Latino population growth, greater student enrollment in K-12 public schools than the population percentage, higher number of Latino students dropping out of high school before getting a diploma than any other student group, underrepresentations in higher education enrollments compared to state population percent and K-12 student enrollments, with high concentration of Latinos in two-year public institutions.
Questions/Comments?
 hbli@asu.edu
|