Sonar – General
Information
Sonar is an acronym for Sound
Navigation Ranging.
Simple definition:
In simplest form, a sonar sends out sound waves. These reflect off a target
and the sonar records the echo. By calculating the time it takes for the sound
wave to travel to its target and bounce back, a distance between the sonar and
the target is established.
Basic formula
Distance
“r” to a single target is determined by the following:
1- Measure
travel time of acoustic signal from transmission to the reception of its echo.
2- Multiply
the time calculated in (1) by the speed of sound in the medium being used
3- Divide the result by two (there and back!)
Example…
1- 0.5 seconds total time
2- 0.5 * 1500 m/s (speed in water) = 750 meters
traveled
3- 750 m / 2 = target is 375 meters away
Applications for sonar
mapping
· Seafloor mapping
· Offshore Oil and Geological
surveying
· Fishing
· Medical
· Non-Destructive Testing
· Remote sensing of Atmospheric
Conditions
· Robotic Navigation
History
First recorded use by people:
Leonardo da Vinci in 1490 placed one end of a tube in water and placed his ear to
the other end, allowing him to hear passing ships. First patent for Sonar filed
in 1912, initiated thanks to the sinking of the Titanic earlier that year. The
motivation was to create an underwater collision-avoidance system. World War 1
further accelerated advancements in the field.
Two kinds of Sonar… Active
and passive
Active - Transmits and Receives (speaker + microphone)
Uses
sound to determine relative positions of submerged objects and the sea floor,
by submitting a sound signal and recording its reflection.
Passive - Receives only (microphone)
A listening device that can determine the presence,
characteristics, and direction of marine noise sources. These may include biological and human generated sounds.
Since this system doesn’t introduce sound into the environment, it doesn’t
disturb marine life. It is also more stealth than a
active system.
Transducer (emitter/speaker)
A transducer converts energy from one form top another (i.e. from
electricity to an audio signal or vice versa). Can be
comprised of one unit for smaller systems, or several units in an array for
larger systems.
Piezoelectrics are often used as transducers because there are no moving parts and they are very sensitive. When current is applied to a piezoelectric, it changes in volume, producing a pressure wave (like a speaker). Conversely, when pressure is applied to a piezoelectric, it produces an electric charge (like a microphone). In some (though not all) cases, the piezoelectric transducer used in the sonar acts as both speaker and microphone.


A piezoelectric element Model 872 Yellowfin sidescan
sonar incorporates piezoelectric sonar
Sonar – Output & Input
Output Power
The output power of a sonar system
is determined by the application in question. Sound dissipates over distance,
so subjects that are farther away from the sonar require greater amplitudes of
signal.
Output power levels vs.
received levels
As sound travels in waves, it
dissipates as the waves spread, loosing energy in the process.
High power - Military applications, commercial sidescan sonars,
deep water echo sounders and fish finders.
Low Power - Shallow water applications and when subject is
closer.
Frequencies Used
Frequency used can range
considerably based on environment and subject…
Lower frequencies - (below 20,000 Hz) have greater range due to lower
rates of sound attenuation over a given distance, BUT cannot distinguish small
objects/fine detail.
High to very high frequencies - (above 100,000 Hz) provide excellent resolution of
fish and other small objects, including sea-floor imaging, but suffer from
signal loss over distance from the source. These systems are only practical in
shallow water or for short range detection of objects near the source. In the
case of sea floor mapping, this means maintaining a certain
offset between the equipment and the seafloor as scanning takes place.
Speed of Sonar
Sonar operates at the speed
of sound. Underwater, this varies with salinity, temperature and pressure while
when traveling through the air, its speed varies with temperature and humidity.
Rough estimates are around 1500 m/s in saltwater and 343 m/s in air.
Input
In sonar, as the audio signal
hits the subject, the signal is scattered in all directions but not uniformly.
The sonar image from the returning echo is composed only of the backscattered
energy that returns to the receiver. The intensity of this backscatter, and
hence the brightness of the image, depends on both the properties of the
system, and the characteristics of the terrain.
Properties of the system - These include the frequency of the signal, signal
duration and power of the signal.
Properties of the terrain - Backscatter is most strongly influenced by objects
that are at least ½ the wavelength in size or larger. The frequency used must
therefore be proportional to the size of the detail required.
Other
terrain characteristics that can influence the quality (intensity) of the
backscatter are texture or roughness, and the inherent reflectivity of the
surface. The reflectivity is governed by the acoustic impedance of the
material, which in turn is determined by the physical properties of the
material including porosity, pore fluids, grain composition, and structure.
In
most cases, a strong backscatter means the material is relatively hard or
contains a lot of texture.
Sonar – Applications and
resulting data
Data Formats
In most cases, the raw data is
placed through algorithms which compensate for various conditions during the
echo recording. This allows the system to provide accurate images, despite
constantly changing conditions. Data formats for the raw data vary depending on
the system being used.
To store processed data, the
Shapefile format (.SHP) is quite common, as it is vector based. It can contain
points, polylines, and polygons These elements, in
turn can have attributes associated with them, like a name or temperature.
Shapefiles actually consists of a set of at least 3 files which work together
(.SHP;.SHX;.DBF).
Other file formats for output
include XTF, SEG-Y, CSV, TIF, GEOTIFF, XYZ. Some
software also supports translation to KMZ, allowing the data to be uploaded
directly to GoogleEarth.

Ultrasound
Used for shorter distances
and much finer resolution than normal Sonar.
Ultrasonography (Medical Sonography) - Uses a transducer to bounce sound waves off the inside
of the body, detecting muscles, tendons, and organs. Operates
in the 1,600,000 - 10,000,000 Hz range. Can offer greater detail than
x-rays and is safer. However, it is believed to heat up soft tissue, and can
create an inflammatory response in some people. While most often used to
monitor pregnancy, it is also used to detect cysts and cancerous cells
including prostate cancer.


2d ultrasound 3d
ultrasound
Ultrasonic testing (a.k.a.
Non-destructive testing) - Uses sonar
with waves in the 100,000 - 15,000,000 Hz range to detect internal flaws or to
characterize the material. Can also detect wall thickness in
objects (i.e. used to measure pipe corrosion). Most commonly used on
metals and alloys, but also used on concrete, wood and composites. The subject
is often immersed in oil or water to improve the transmission of the signal.
Two
basic modes…
Reflection
(a.k.a. Pulse-echo) mode - A typical
sonar setup. The transducer acts as
both transmitter of the wave and receiver of the echo. The echo comes from a
geometric interface within the object, such as the back wall of the object, or
from an imperfection
within the object.
Attenuation (a.k.a.
Through-transmission) mode - A transmitter
send the wave through the object on one side, and a separate receiver detects
the wave on the other side. Imperfections in the object reduce (dissipate) the
amount of signal received, thus revealing imperfections in the object.

A man with a blue hat, testing the
wall thickness of a steel pipe

Non-destructive
testing of a swing shaft showing spline cracking
Seafloor Mapping
Sonar equipment is either installed directly
on the ship or towed in the water at a controlled depth behind the ship.
Single Beam Sonar
In
this basic system, a
single pulse is emitted directly below the transducer with a narrow footprint
at specific intervals. Typically dose not provide
continuous coverage of the seafloor (think of a pixilated image, rather than a
continuous tone). Resolution depends on footprint size, sampling interval,
sampling speed, and distance between samples. The result is a two-dimensional
image.


A Single Beam Sonar system

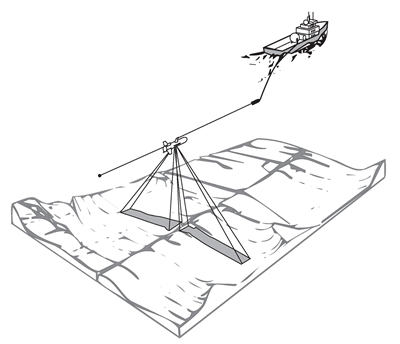
Sidescan Sonar
More
sophisticated sonar for large scale mapping (called “swath” mapping; swath = a long,
broad strip). Projects a narrow fan shaped beam from the sides of the unit
which illuminates a swath. The image is produced as the instrument travels, sweeping the swath it produces along its subject’s
surface. The width of the swath for offshore scanning is usually several times
wider than it is deep (in oceans, about 500 meters wide; for shallower waters,
it can be down to 150 meters). Much like mowing the lawn, this is done in
successive passes. Then the information is stitched up into a final image.
Multibeam sonar can produce 2d or 3d images.

Side-scan sonar in operation

Strips of data (a “sidescan mosaic”) prior to stitching
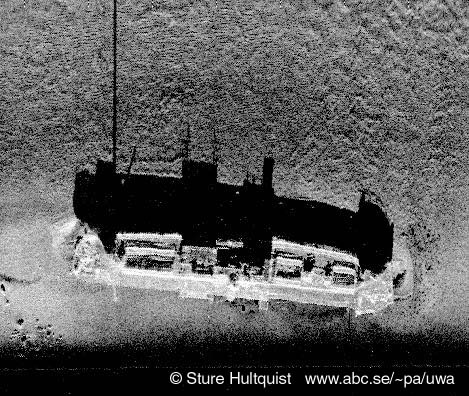
Example of a submerged
ship, the Swedish “S/S Nedjan”, in 105 feet of water
captured with sidescan sonar.
Multibeam Sonar
The ultimate in positional accuracy. Uses an array of receivers
(hydrophones) that focus reception on very narrow angled paths. This
allows the Multibeam system to scan for distance and depth, giving a very accurate 3d images. Absolute
measurements down to 10 cm. The position of the head is calibrated using
GPS and additional equipment on shore. Millions of XYZ points are collected and
any unwanted noise is filtered out, resulting is very high definitions.
Multibeam sonar is extensively used for bathymetry (underwater topography).
These systems are normally installed in the hull of the boat.
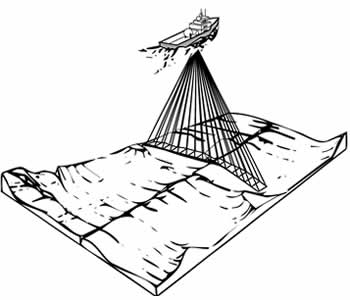
geometry of a typical Sidescan
sonar on the left and a Multibeam sonar on the right

The British shipwreck
HMS Royal Oak, captured in its final resting position off the seafloor in

Bathymetric Multibeam sonar image looking west
from Georgian Bay at the submerged Niagara escarpment and the sill between the
Huron and
Fish Finder
These units are able to
distinguish both the
sea floor and fish. Fish are easy to visualize with sonar because their air-filled
bladder have a different density than the surrounding water. High-end Fish
Finders operate between 50,000 and 200,000 Hz. Good to a depth of about 750
meters. Other uses of Sonar in fishing include sonar sensors attached to the
bottom of nets that measure the distance from the net to the sea floor, and
systems that measure how many fish are currently in the net.
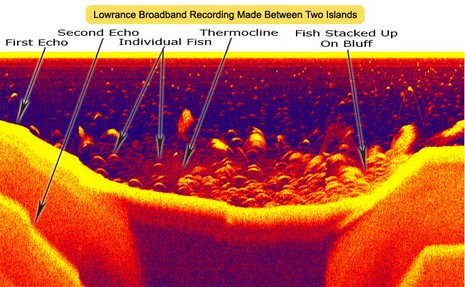
This aint your daddy’s
Fish Finder! the Lowrance’s Broadband Sonar, released
in 2008, is the latest and greatest in consumer grade sonar.
Off-Shore Surveying for
Oil
An array of air-guns is towed
behind a ship. The array sits just below the surface of the water. The guns
emit a low frequency (10-300Hz), high intensity (215-250 dB) sound every couple
of seconds. This venting of high pressure generates seismic waves in the
earth’s crust beneath the sea, which can travel hundreds of kilometers from the
source. Sound waves bounce off boundaries between different types of rock in different ways. The
resulting echo can then be studied to show geological structures of types often
associated with petroleum deposits.

On-Shore Seismic Surveying
uses seismographs to measure the resulting vibration of the earth rather than
the wave itself. They are therefore not strictly considered Sonar and are not
covered in this research.
Setup for Oil Surveying
SODAR
Sonic Detection and Ranging (an upward-looking in-air sonar) is used for atmospheric investigations,
operating in the 4,000 Hz range. These collect wind speed at various heights
above the ground, along with the thermodynamic structure of the lower layer of
the atmosphere. The frequency shift of the echo varies according to the wind
speed, while the intensity of the echo varies according to thermal conditions.
SODAR is also known as echo sounders or acoustic radar.

\\
DSDPA.90-24 Complete Doppler SODAR System

An array of transducers found inside a SODAR
system


Data obtained using a
SODAR system. Angle of the lines indicates direct of wind. In the image on the
right, length of the line indicates wind speed.
Bibliography…
http://woodshole.er.usgs.gov/operations/sfmapping/sonar.htm
http://www.soest.hawaii.edu/GG/HCV/NEWSV2N1/mackay1.html
http://www.sidescan.lsu.edu/Seafloor_Mapping.htm
http://www.environment.gov.au/coasts/species/cetaceans/seismic-sonar.html
http://www.csc.noaa.gov/crs/rs_apps/sensors/multi_beam.htm
http://www.olympusndt.com/en/ndt-tutorials/phased-array/
http://gsc.nrcan.gc.ca/marine/gbgi/proj_ptgrey_e.php
http://www.sea-viewdiving.com/diving_equipment/sonar_cameras/yellowfin.htm
http://www.tritech.co.uk/products/info/products-info-sidescan_sonars.htm
http://www.bohol.gov.ph/vgo-sp/images/announce/oil_image002big.jpg
http://www.metek.de/produkte_dsdpa24.htm
http://www.alliance-technologies.net/meteo/PARTENAIRES/METEK/dsdpa9064.htm
http://www.src.com/sodarrass/sodar_rass.html
http://www.panbo.com/archives/cat_sonar.html
http://www.biral.com/met/sodar/sodarapp5.htm
http://www.uao.bnl.gov/mesonet/
http://www.csc.noaa.gov/crs/rs_apps/sensors/single_beam.htm
http://www.eyethinkcorp.com/resources/expboy/seismo.html
http://www.ece.eps.hw.ac.uk/Research/oceans/projects/rauver/oceansweb/serpulids.html
http://www.tritech.co.uk/support/support-software-seanet-tools.htm
http://www.echoview.com/WEBHELP/_Introduction/Supported_echosounders.htm
http://www.oicinc.com/history_sonars.html
sample data
http://pubs.usgs.gov/of/1998/of98-801/bathy/data.htm
http://research.usm.maine.edu/gulfofmaine-census/data-mapping/gis-data-layers/