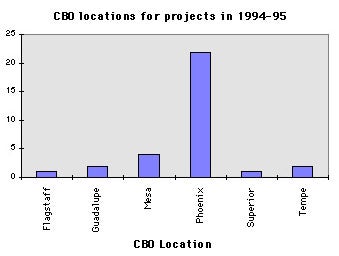
Graph showing no. of projects for different CBO Locations in 1994-95
TABLE 23
|
CBO LOCATION Avondale Flagstaff Guadalupe Mesa Phoenix Superior Tempe
|
|
Graph showing no. of projects for different CBO Locations in 1994-95
TABLE 23
|
CBO LOCATION Avondale Flagstaff Guadalupe Mesa Phoenix Superior Tempe
|
|